Multi-Year Analytics for Conventions: Track, Compare, and Grow Your Event
Last updated: April 2026. This article is for informational purposes only. Statistics and third-party features referenced may have changed since publication. Terms apply.
If you run a recurring convention, your most valuable asset is not your venue contract, your guest relationships, or even your brand. It is your data. Specifically, it is the year-over-year data that tells you what is working, what is declining, and where your biggest opportunities lie. Yet most convention organizers treat every year as a blank slate, rebuilding their event from memory and gut instinct instead of building on a foundation of measured results.
Multi-year analytics changes that. It transforms your convention from a series of isolated events into a continuously improving operation with compounding advantages. And it is one of the clearest differentiators between organizations that grow steadily and those that plateau or slowly shrink without understanding why.
Why Year-Over-Year Data Matters More Than Single-Event Stats
Every event platform gives you some data after your convention ends. You can see how many tickets you sold, how much revenue came in, maybe how many people checked in at the door. That is useful, but it is a snapshot. A snapshot tells you what happened. A trend tells you where you are headed.
Consider the difference between these two statements: "We sold 3,200 tickets this year" versus "We sold 3,200 tickets this year, up 12% from last year and 34% from three years ago, with VIP packages growing from 8% to 15% of total sales." The first is a number. The second is a story -- one that tells you your event is growing, your premium offerings are resonating, and you have a trajectory you can project forward.
Year-over-year data lets you answer questions that single-event stats simply cannot:
- Is our attendance actually growing, or are we just selling the same number of tickets to the same people?
- Are our vendor fees competitive? Are we losing vendors or gaining them?
- Which marketing channels are producing better results over time?
- Is our no-show rate improving as we change our communication strategy?
- Are we spending more per attendee on operations than we were two years ago?
Without multi-year comparison, you are flying blind. You might feel like things are going well, but feelings are not a strategy. Data is.
The Problem: Starting From Scratch Every Year
Most convention organizers face a painful reality. Each year, their data lives in a different spreadsheet, a different ticketing platform, or a different team member's memory. The person who ran registration last year left the team. The spreadsheet with vendor revenue is somewhere on a shared drive. The email marketing metrics are locked in whatever tool you were using at the time.
Even organizers who use dedicated event platforms often hit a wall. Platforms like Eventbrite treat each event as an isolated entity. You create a new event, sell tickets, run the show, and get a report. Next year you create another new event. There is no concept of these two events being editions of the same convention. There is no way to see your 2024 and 2025 and 2026 numbers side by side in a single dashboard. You are left exporting CSVs and building comparison spreadsheets by hand -- if you bother at all.
This is not just an inconvenience. It is a structural disadvantage. Organizations that cannot easily compare their performance across years make worse decisions. They repeat mistakes they have already made. They fail to notice gradual declines until it is too late. They cannot make a compelling case to sponsors, venues, or investors because they lack the longitudinal data those stakeholders want to see.
Event Series: The Foundation of Multi-Year Analytics
The solution starts with a simple but powerful concept: the event series. An event series groups multiple annual editions of the same convention under a single umbrella. "MegaCon 2024," "MegaCon 2025," and "MegaCon 2026" are not three unrelated events -- they are three editions of the MegaCon series. This structural relationship is what makes cross-year comparison possible.
Creating an event series
In Confanum, creating an event series takes about 30 seconds. You give it a name, an optional description, and select the events that belong to it. The series becomes a persistent container that accumulates data with every edition you add. Even if you are adopting the platform mid-stream and only have one year of data so far, creating the series now means you are ready to start comparing as soon as your next event wraps.
Many-to-many assignment for multi-event organizers
Many convention organizers run more than one event. A production company might operate a comic convention, an anime convention, and a horror convention -- all under the same organizational umbrella. The event series model supports this with many-to-many relationships. A single event can belong to multiple series if needed, and a single organizer's dashboard can display analytics across all of their series simultaneously.
This is particularly valuable for organizations that want to compare performance across different event brands. Is your anime convention growing faster than your comic convention? Are operational costs per attendee lower at one event than another? The series structure makes these comparisons trivial.
Key Metrics to Track Across Years
Once your event series is established, the question becomes: what should you actually track? The answer depends on your goals, but these five categories cover the metrics that matter most for recurring conventions.
Attendance
Attendance is the most visible metric, but it is more nuanced than a single number. Track these dimensions:
- Total unique attendees -- the headline number, but make sure you are counting unique people, not total ticket scans (a three-day attendee who checks in each morning is one person, not three).
- Attendance by day -- which days are strongest? Is Saturday consistently 40% higher than Sunday? Is Friday growing or shrinking as a percentage?
- Attendance by ticket type -- how many single-day versus multi-day? How many VIP versus general admission? Are your premium tiers growing?
- No-show rate -- the gap between tickets sold and actual check-ins. A high no-show rate (above 15-20%) suggests pricing or communication problems. Tracking it over years tells you if your efforts to reduce it are working.
- New versus returning attendees -- if you can track this (through account creation or email matching), it tells you whether you are growing by attracting new people or retaining loyal ones. Ideally, both.
Revenue
Revenue is where the real story of your event's health lives. Break it down into components:
- Ticket revenue -- total, by ticket type, and by sales channel (online pre-sale versus at-the-door). Track your average revenue per attendee.
- Vendor fees -- total booth revenue, average fee per vendor, and occupancy rate (percentage of available booths sold). A full vendor hall at low prices is not the same as a full vendor hall at market rate.
- Sponsorship revenue -- total and by sponsorship tier. Are you growing your sponsor base, or are the same three companies paying the same amount every year?
- Merchandise and add-on revenue -- photo ops, autographs, exclusive merchandise, VIP upgrades purchased after initial ticket sale.
- Revenue per attendee -- your single most important financial metric. If attendance grows 10% but revenue per attendee drops 15%, you are going backwards.
Engagement
Engagement metrics tell you how deeply attendees are interacting with your event beyond just showing up:
- App downloads and active users -- what percentage of attendees use the mobile app? Is that growing?
- Session check-ins -- how many attendees check into individual panels, workshops, and events? Which programming categories have the highest participation rate?
- Survey response rates -- are attendees engaged enough to give you feedback? A declining response rate may signal declining enthusiasm.
- Live polling and Q&A participation -- if you use interactive features during panels, participation rates reveal how engaged your audience is in real time.
- Social media mentions and user-generated content -- harder to track precisely, but directionally valuable.
Operations
Operational metrics reveal the efficiency of your event machine:
- Average check-in time -- how long does it take to process an attendee through registration? If this is improving year over year, your technology and staffing decisions are paying off.
- Volunteer hours -- total hours contributed, average shift length, and volunteer retention rate (how many come back next year).
- Support ticket volume -- how many attendee issues were escalated to your support team? What categories? Is the volume per attendee going up or down?
- Vendor setup and teardown time -- operational efficiency that affects vendor satisfaction and venue costs.
Marketing
Marketing metrics close the loop between your promotional efforts and actual results:
- Email list size and growth rate -- a growing list means a growing pool of potential attendees.
- Email conversion rate -- what percentage of email recipients buy tickets? Is that rate improving as you refine your messaging?
- Promo code performance -- which codes drove the most sales? Which marketing partners delivered the best ROI?
- Social media reach and follower growth -- directional indicators of brand awareness.
- Cost per acquisition -- how much did you spend on marketing per ticket sold? This should ideally decrease over time as your organic audience grows.
Cross-Event Comparison Dashboards
Collecting data is one thing. Making it useful is another. Cross-event comparison dashboards are where multi-year analytics becomes actionable. Instead of flipping between spreadsheets or PDFs from different years, you see your metrics side by side in a single view.
Side-by-side metric comparison
The most straightforward view: pick two or more editions of your event and compare any metric directly. Total attendance 2024 versus 2025. Vendor revenue 2023 versus 2024 versus 2025. VIP ticket sales as a percentage of total for each year in your series. This view instantly reveals whether you are improving, holding steady, or declining in any dimension.
Growth rate calculations
Raw numbers are useful, but growth rates are more informative. A dashboard that automatically calculates year-over-year percentage change for every metric saves you from doing arithmetic in your head. More importantly, it lets you spot divergent trends. Maybe your attendance is growing at 8% per year but your vendor revenue is growing at 15% -- that tells you your vendor program is outperforming your general attendance growth, which might mean you should invest more in promoting the vendor hall to attendees.
Trend visualization
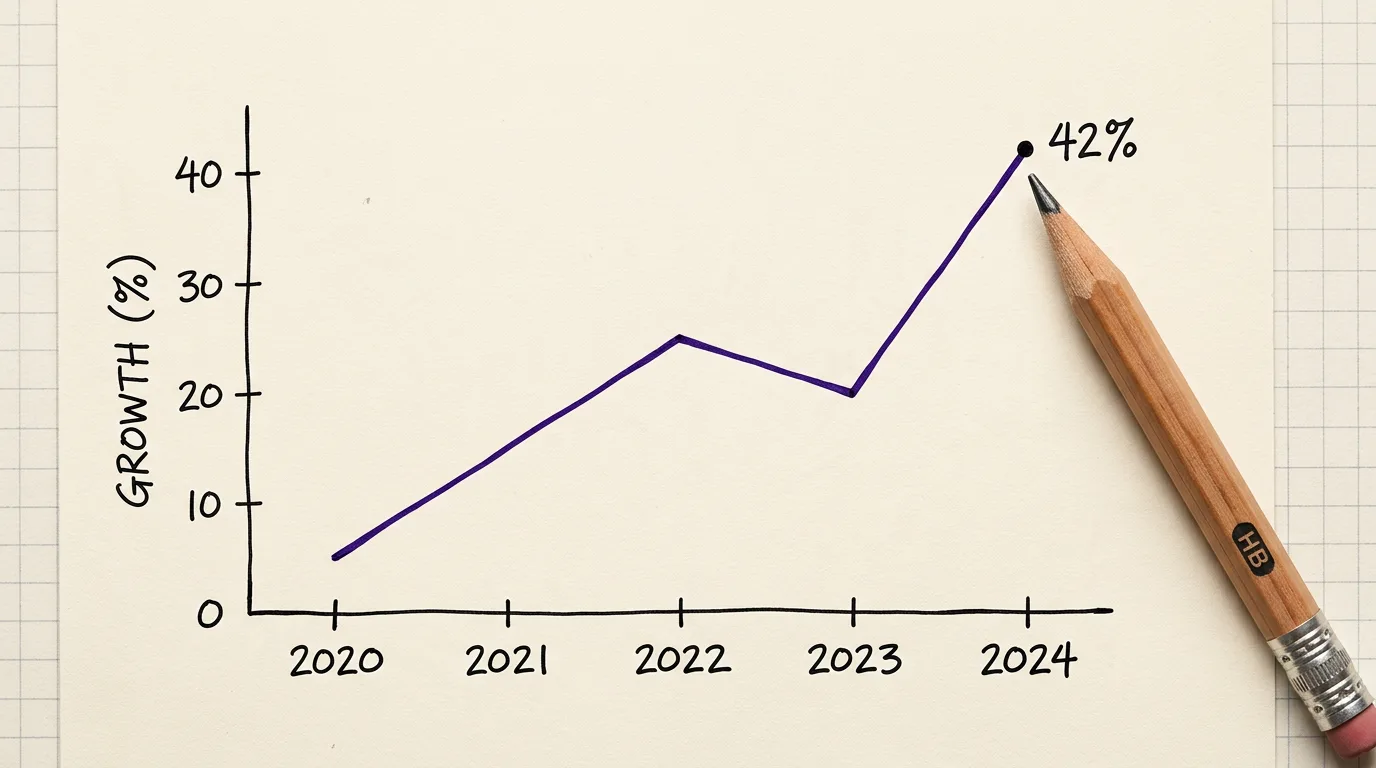
When you have three or more years of data, trend lines become powerful. A chart showing attendance over five years immediately communicates your event's trajectory in a way that no table of numbers can. These visualizations are invaluable for internal planning, but they are also compelling for external stakeholders. A sponsor considering a multi-year deal wants to see an upward trend line, not a single year's number.
Using Data to Make Better Decisions
The point of multi-year analytics is not to produce pretty charts. It is to make better decisions. Here are the specific questions your data should help you answer.
Which guest categories drive the most ticket sales?
Over multiple years, you can correlate guest announcements with ticket sale spikes. Did announcing a voice actor headliner produce a bigger sales bump than announcing a comic artist? If your data consistently shows that celebrity guests from a specific franchise drive the most sales, that informs your booking strategy and budget allocation for next year.
Which days are strongest and weakest for attendance?
If Sunday attendance has declined for three consecutive years, that is a signal. Maybe you need stronger Sunday programming, a lower Sunday-only ticket price, or a marquee event (like a cosplay contest or closing ceremony) that gives people a reason to stay. Without multi-year data, you might not notice the trend until Sunday becomes unsustainably low.
Where is vendor revenue trending?
Are you charging more for booths each year? Are vendors still filling up, or are you seeing more vacancies? Is the average vendor's reported sales (if you survey them) going up or down? This data helps you set pricing that maximizes your revenue without pricing out small vendors who add character and variety to your hall.
Are VIP packages growing as a percentage of sales?
A healthy VIP trend means your premium offerings are resonating. If VIP percentage is flat or declining while total attendance grows, your VIP package may need refreshing. Conversely, if VIP is growing rapidly, you might be able to introduce an even higher tier -- an "Ultra VIP" or "Founders Circle" -- to capture more revenue from your most enthusiastic attendees.
Which marketing channels have the best ROI?
If email consistently converts at 4% while social media ads convert at 0.8%, you know where to concentrate your budget. But this only becomes clear with multi-year data. A single year might be an anomaly. Three years of the same pattern is a strategy.
Forecasting and Goal-Setting for Next Year
Multi-year data transforms your planning process from guesswork into projection. Instead of saying "we hope to sell 3,500 tickets next year," you can say "based on our three-year growth rate of 11% and the strength of our announced guest lineup, we project 3,550 tickets with a confidence range of 3,300 to 3,800."
This level of precision matters for practical reasons. It determines how large a venue you need. It tells you how many volunteers to recruit. It informs your catering order, your merchandise print run, and your insurance coverage. Over-projecting wastes money. Under-projecting creates bad attendee experiences -- long lines, sold-out vendor items, not enough seats in panel rooms.
Set specific, measurable goals for each metric category:
- Grow total attendance by 10%
- Increase VIP packages from 12% to 15% of total ticket sales
- Reduce no-show rate from 18% to 14% through improved pre-event communication
- Grow email list by 25% through post-event signup campaigns
- Increase vendor occupancy rate from 88% to 95%
- Reduce average check-in time from 90 seconds to 60 seconds
When you have historical data to anchor these goals, they become realistic instead of aspirational. And when next year's event wraps, you can measure your actual performance against each goal and recalibrate for the following year. This is how compounding improvement works.
Reporting to Stakeholders, Sponsors, and Venue Partners
You are not the only person who benefits from multi-year analytics. Your stakeholders -- sponsors, venue partners, local tourism boards, investors, or a parent organization -- all want evidence that your event is healthy and growing.
Sponsors in particular are hungry for data. A sponsor deciding whether to renew at a higher tier wants to see that your audience is growing, that engagement is deepening, and that their brand exposure is increasing. "We had 3,200 attendees, up 12% year over year, with app engagement up 25% -- meaning more eyes on in-app sponsor placements" is a dramatically stronger pitch than "we had a good year."
Venue partners use your data to plan their own operations. If you can show them three years of check-in flow data that demonstrates your peak arrival window, they can staff accordingly. If you can show a consistent growth trend, you strengthen your negotiating position for multi-year venue contracts or expansion into additional space.
The ability to generate polished, data-rich reports for external audiences is a competitive advantage that many convention organizers overlook. It turns your analytics from an internal tool into a sales asset.
Common Analytics Mistakes Convention Organizers Make
Having data is not the same as using it well. Here are the mistakes we see most often.
Tracking vanity metrics instead of actionable ones
Social media followers and website page views feel good but rarely correlate with ticket sales or attendee satisfaction. Focus on metrics that connect to revenue, retention, and operational efficiency. If a metric does not help you make a specific decision, it is noise.
Comparing numbers without normalizing
If your event grew from 2,000 to 3,000 attendees, raw vendor revenue should increase. That does not mean your vendor program improved -- it might have just scaled proportionally. Use per-attendee and percentage-based metrics to understand real performance changes independent of overall growth.
Ignoring declining metrics when the headline number is up
Total attendance might be growing while Sunday attendance declines, volunteer retention drops, and average revenue per attendee falls. If you only look at the top-line number, you miss the cracks forming underneath. Multi-year analytics is about the full picture, not just the highlight reel.
Not collecting data until it is too late
The best time to start tracking was your first year. The second best time is now. Every year you run without structured data collection is a year of comparisons you will never be able to make. Even if your data for this year is imperfect, capturing it creates a baseline for next year.
Keeping data siloed across tools and team members
If your ticketing data is in one platform, your vendor data is in a spreadsheet, your volunteer data is in another tool, and your marketing data is in yet another, no one will ever assemble the complete picture. A unified platform that captures all of these data streams is not a luxury -- it is the difference between having analytics and having a data graveyard.
Building a Data-Driven Culture in Your Event Team
The final piece is cultural. Multi-year analytics only works if your team actually uses it. That means making data part of your regular workflow, not something you look at once a year in a post-mortem meeting.
Start with a debrief that is numbers-first
Within two weeks of your event, hold a debrief where every department presents their key metrics compared to last year. Registration shows check-in times and no-show rates. Programming shows session attendance and survey scores. Vendors shows occupancy and revenue. Marketing shows conversion rates and list growth. Make the data the starting point for discussion, not anecdotes.
Set goals publicly and review them publicly
When your team knows that attendance growth, volunteer retention, and revenue per attendee are the metrics that matter, they orient their efforts accordingly. Public goals create accountability. Public reviews of results create learning.
Make data accessible to everyone who needs it
Your analytics dashboard should not be locked behind a single admin account. Give department heads access to the metrics relevant to their area. Let your volunteer coordinator see volunteer retention trends. Let your marketing lead see conversion rate history. People who can see their own data make better decisions without needing to ask for a report.
Celebrate improvements and investigate declines
When a metric improves, acknowledge the work that drove it. When a metric declines, treat it as a problem to solve, not a failure to punish. A data-driven culture is curious, not judgmental. The question is always "what does this tell us?" and "what should we do differently?"
The Competitive Advantage of Long-Term Data
Most event platforms were built for one-off events. They give you a dashboard for a single event and call it analytics. That is fine for a one-time corporate conference or a wedding expo. But for recurring conventions -- events that run every year and need to grow every year -- single-event analytics is fundamentally insufficient.
The convention organizers who will thrive over the next decade are the ones who treat their event as a business with measurable, improvable performance metrics tracked over time. They will know exactly which investments produce returns, which experiments failed, and where their next percentage point of growth is going to come from.
If you have been running your convention for years without structured multi-year analytics, you have not lost anything -- you just have not started capturing the value yet. Start now. Build your event series. Define your key metrics. Set your baselines. By next year, you will have your first year-over-year comparison. By the year after that, you will have trend lines. And from that point forward, every decision you make will be sharper, faster, and more confident than it was before.
Start tracking what matters
Confanum's event series and multi-year analytics dashboards give you side-by-side comparison, growth tracking, and trend visualization across every edition of your convention -- all in one platform.
Schedule a DemoThe First-Time Convention Organizer's Complete Checklist
A comprehensive planning guide covering every phase from venue selection to post-event debrief.
Ticketing and Payments Setup: A Step-by-Step Guide
Configure multi-provider payments, promo codes, and ticket types to maximize your event revenue.
Email Marketing Automation for Event Organizers
Build automated email sequences that drive ticket sales and keep attendees engaged year-round.